Data Exploration Web App - Part 2 - R/Shiny Supporting tagline
Here we go. Our first attempt at building a web app to explore the Project Tycho data. For this first go around we're going to see what it's like to build a web app using R and Shiny. In this post we'll just get a start on things and get the general idea down by building a very simple UI. Then next post we'll expand the app into something that's a lot more interesting.
If you haven't read part 1 of the series, I would encourage you to do so. It describes the data set and shows some of the types of things we want to be able to do.
If you want to try the code out yourself you'll need to make sure you have the shiny package
installed in R. To save space I won't necessarily put all of the code in the posts, but will link to Gists that
you can download at interesting points as we build the app.
The basics
In order to create a Shiny app you have to create two files, ui.R and server.R.
You can probably figure out what the purpose of each is. Let's start off by
building just a very basic app that will allow the user to select a disease
from a dropdown and we'll display a string containing the disease name that
was selected. Not very useful, but it will get us going.
Let's start by putting together the user interface side of the app. We do this by creating a file
called ui.R and putting our UI components into it. Here is the code for ui.R:
library(shiny)

shinyUI(pageWithSidebar(
    headerPanel("Tycho Data Exploration"),
    sidebarPanel(
        htmlOutput("diseaseSelect")
        ),

    mainPanel(
        textOutput("textDisplay")
        )
    )
)
So what does this do? It starts by putting everything for the UI into the shinyUI() function
call. Inside we wrap everything in a call to pageWithSidebar(). According to the Shiny docs this
function is used to "Create a Shiny UI that contains a header with the application title, a sidebar
for input controls, and a main area for output.". It takes three arguments: headerPanel,
sidebarPanel and mainPanel. In this case I'm simply putting the text "Tycho Data Exploration" in the
header panel.
The sidebar panel is going to require a bit of a leap of faith until we look at the server code. This is creating a div in the page with some named HTML output from the server. When we get to look at the server code you will see how they are linked together. In the main panel I am doing something similar except specifying the the value from the server will be plain text instead of HTML.
That's all we need for our UI for now. Let's look at the server code now. This is the code for server.R
library(shiny)

fileUrl <- url("http://s3.amazonaws.com/data-excursions/states_cases.Rda")
load(fileUrl)

diseases <- unique(as.character(states_cases$disease))
states <- unique(as.character(states_cases$state))

shinyServer(function(input, output) {

    output$diseaseSelect <- renderUI({
        selectInput("disease", "Disease", diseases)
    })

    output$textDisplay <- renderText({
        paste0("You selected ", input$disease)
    })
  }
)
There is a little bit more here since this is the part doing the real work. We first load up the
data from the saved file (into a data frame named states_cases) then extract the list of diseases
and states contained in the data frame.
Next comes the code that's the Shiny server code itself. Basically we just pass it a function that takes two arguments (the input and the output). Then inside this server function we hook up UI elements to our dynamic code.
Remember how we created elements in the UI named "diseaseSelect" and "textDisplay"? Well, here is
how we hook the server side code to those UI elements. We set output$diseaseSelect to the value we
want to go into the diseaseSelect element and output$textDisplay to whatever we want to go into
the textDisplay element.
First let's look at this chunk of code that is creating our drop down box of diseases:
output$diseaseSelect <- renderUI({
    selectInput("disease", "Disease", diseases)
})
For the diseaseSelect element (which is in the sidebar panel) we want a drop down box with all the diseases in it. We can create
that by calling the Shiny selectInput() function. We pass the function an id, label and the list
of choices. In this case we're giving it the id disease, label Disease and the list of choices
will come from the diseases list that we created from the unique diseases in our data frame.
Now the chunk of code that is putting output into the main panel:
output$textDisplay <- renderText({
    paste0("You selected ", input$disease)
})
For the textDisplay element (in the main panel) we're just going to print out some text that
includes the name of the disease to see how we grab input from the UI and use it. So we're calling
the renderText function and just passing it some text. This creates a "reactive" function that is
"connected" to the input$disease value, so that whenever input$disease changes value it will
update this function. We get the disease that the user selected
from the selectInput drop down from input$disease (remember =disease was the id we gave to it).
For more about what reactivity is see the reactivity section of the Shiny tutorial.
So this is pretty simple. The UI is basically a drop down box with a list of diseases. When you
choose a disease from the drop down the text in the main panel changes to include the name of the
selected disease. Not very exciting, but it demonstrates the basics and gives you a chance to make
sure you have everything setup right. You can run this app yourself from R by loading the Shiny
library (library(shiny)) then running runGist("8775464"). The Gist for this part is at
Gist 8775464.
Here is what it looks like: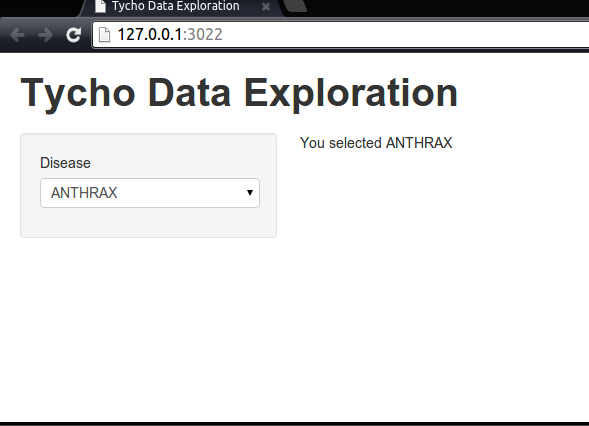
Making it a bit more interesting
Ok, that really isn't a very interesting application, but at least we have the basics of Shiny under out belt. Next post I'll start enhancing the app with some more interesting elements.
blog comments powered by Disqus